
Read the dashboard
Five pages
| Page | What to use it for |
|---|---|
| Overview | Today’s totals and hourly activity, model/agent shares, and a separate historical range. |
| Trends | Compare calls, sessions and token usage over days, weeks, months or hours; inspect model rows and the activity calendar. |
| Sources | Inspect discovery, enablement, versions, health, user ownership and collection schedules. |
| Details | Page through normalized records without prompts, responses or tool output. |
| Settings | Configure timezone, language, theme, collection, retention, exchange, estimates and optional telemetry. |
Select a user and time range before comparing results. Overview’s today and historical sections have independent selections. Click or drag across a chart to restrict its totals, shares and model table to that interval. Reset clears the selection. The activity heatmap and weekday distribution show the complete selected range rather than the temporary chart selection.
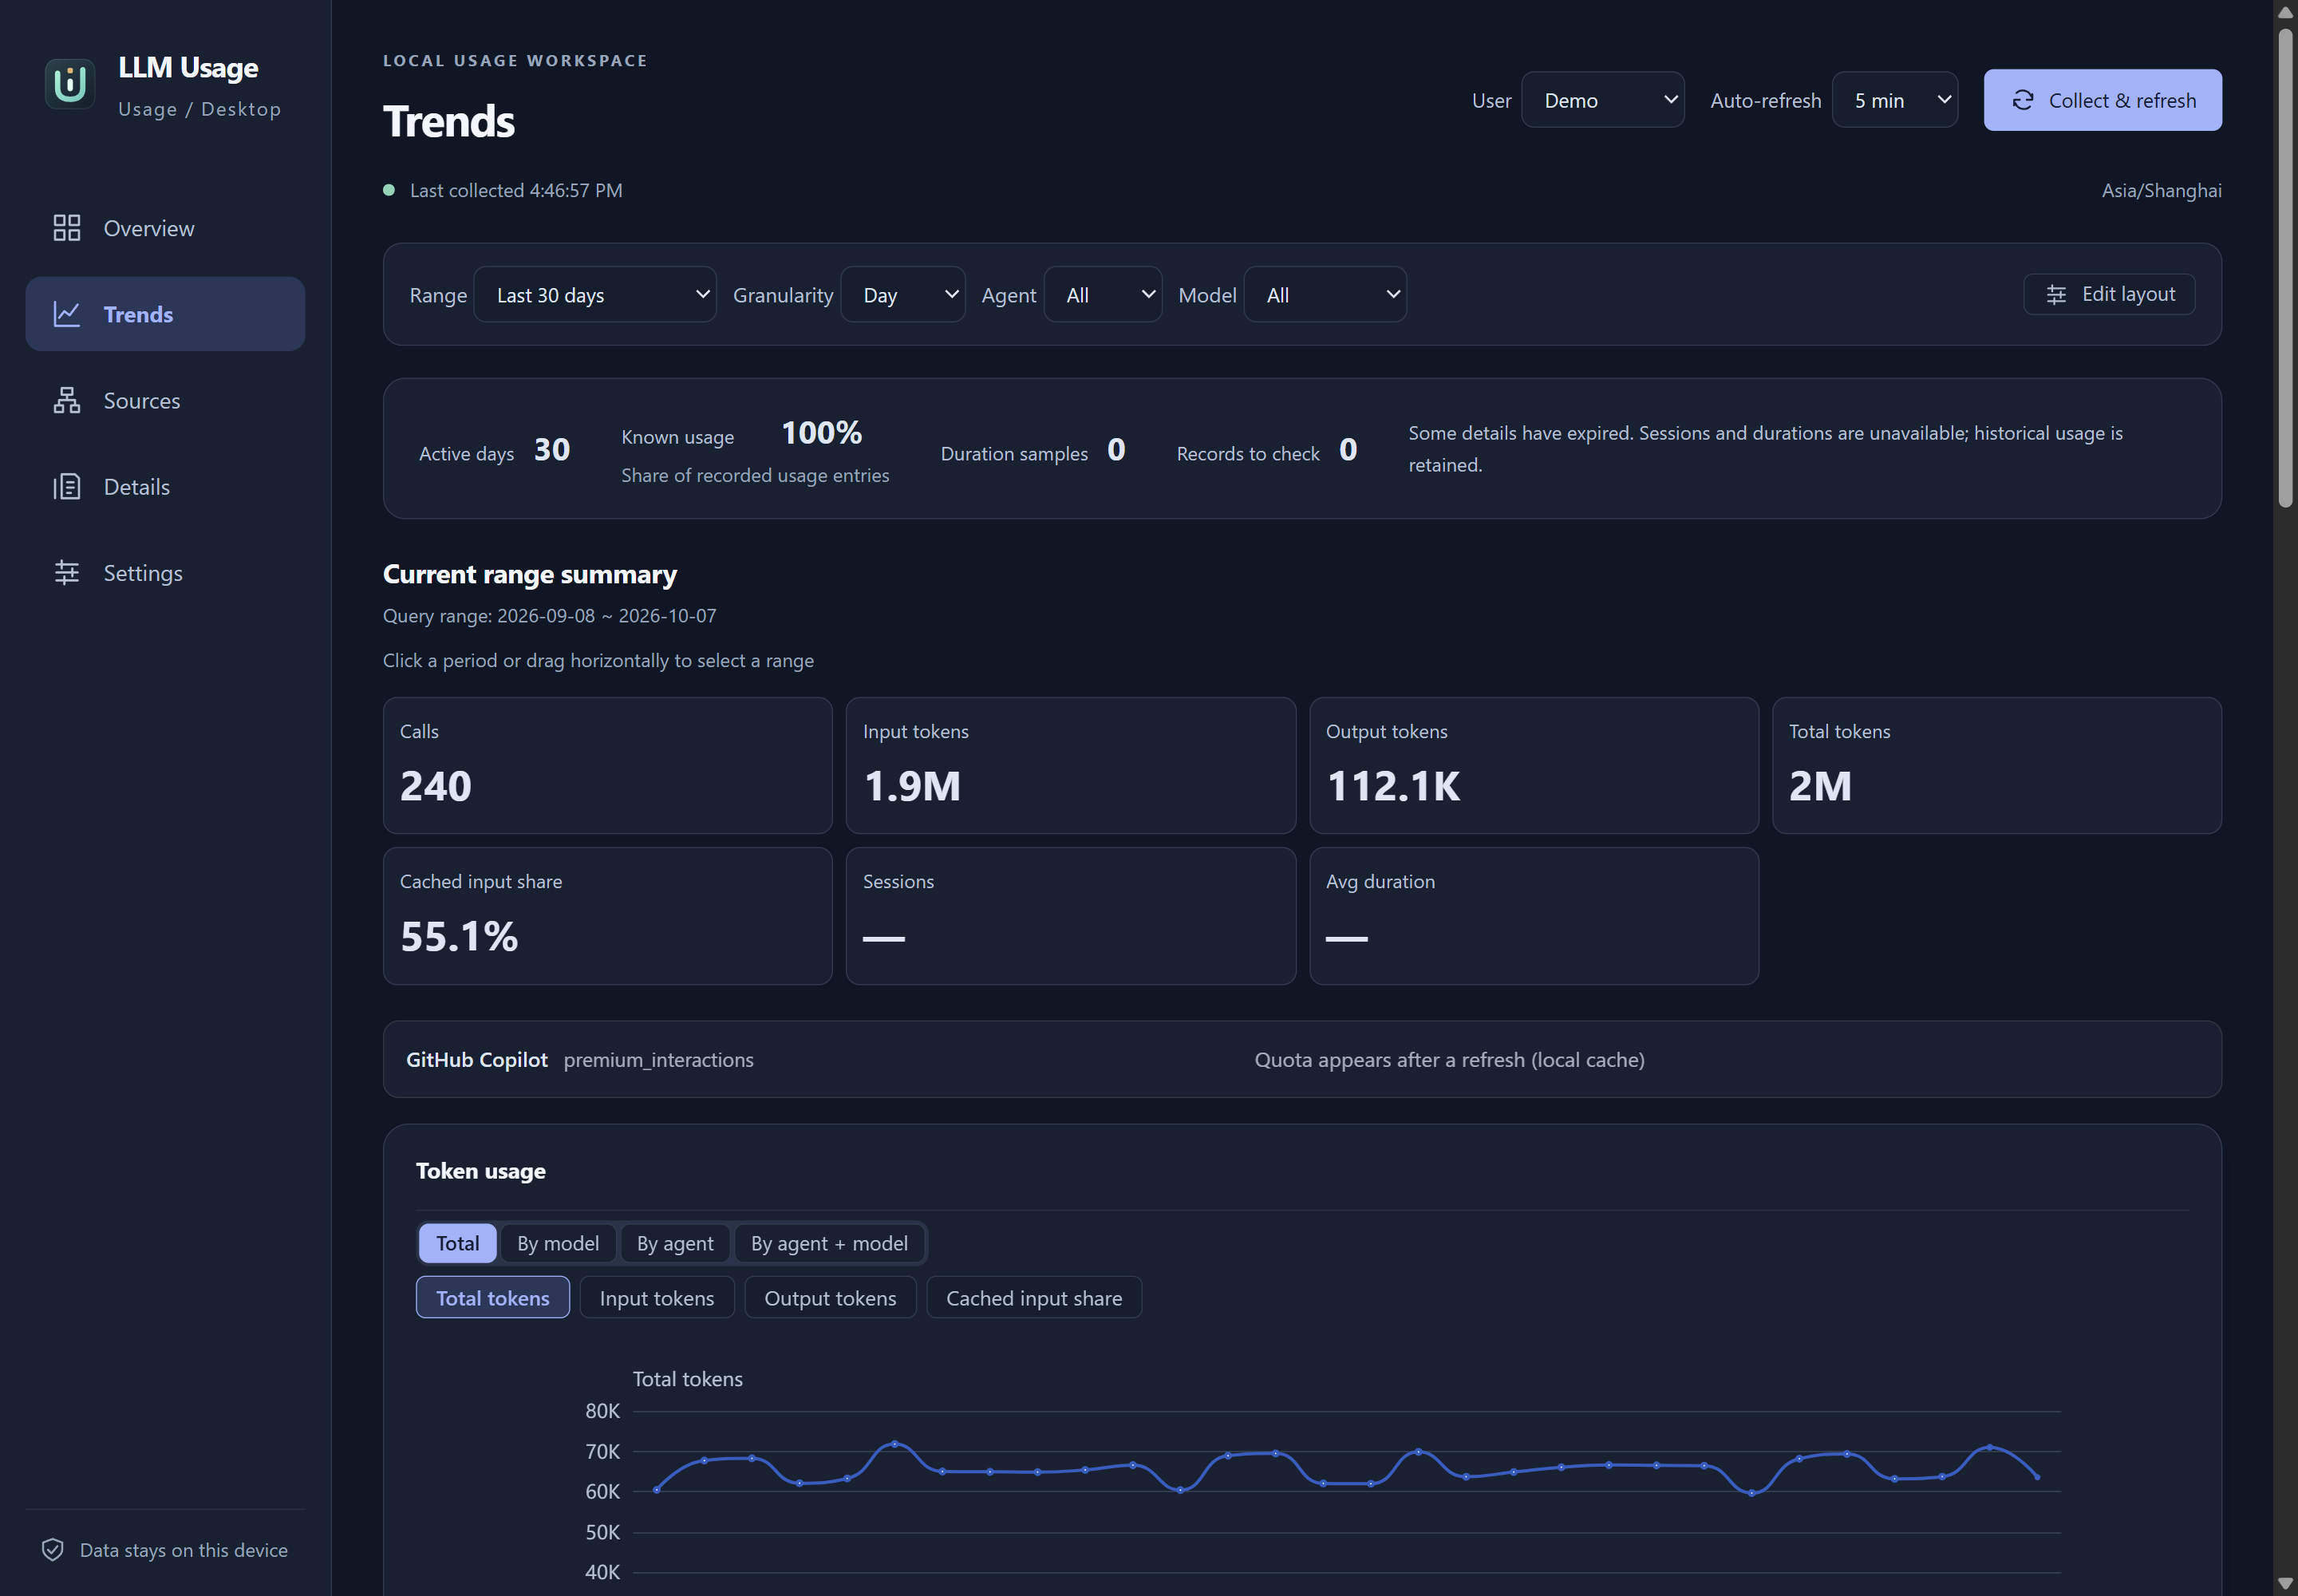
Actual English desktop UI with isolated synthetic usage. Dark theme; no personal data.
Tokens, calls and observations
Input tokens are divided into mutually exclusive uncached, cache-read and cache-write buckets when the source’s field meanings have been verified. Total input includes these buckets; reasoning is an output subset when the provider reports it that way. Do not add reasoning again to output that already contains it.
Some records are usage observations or cumulative snapshots rather than individual requests. A message, tool round, premium request or histogram sample is not automatically a model call. The verified source fields determine which quantities can be counted.
Unknown means that the source did not provide a verified value. It is not zero. Known totals can be lower bounds when other fields are missing. Read coverage notes and known record counts alongside the amounts; a healthy source can still have incomplete fields.
Cache rate and models
Cache hit rate is the sum of known cache-read input divided by known total input for the same eligible records. It is weighted by input, not an average of daily percentages. No eligible input or a zero denominator is shown as a gap.
Agent, provider, model and billing channel are separate identities. A model name does not establish the actual billing provider or subscription channel. Price reference rows can therefore be incomplete even when token usage is known.
Record details
Open Details to inspect normalized records for the selected user. Choose a time range, agent and model to narrow the table. Each row shows its timestamp, source agent, model, record category, known token fields, duration and session identifier when available. The table excludes prompts, responses and tool output. A row may represent a usage observation rather than an individual call; read its category and source field rules.
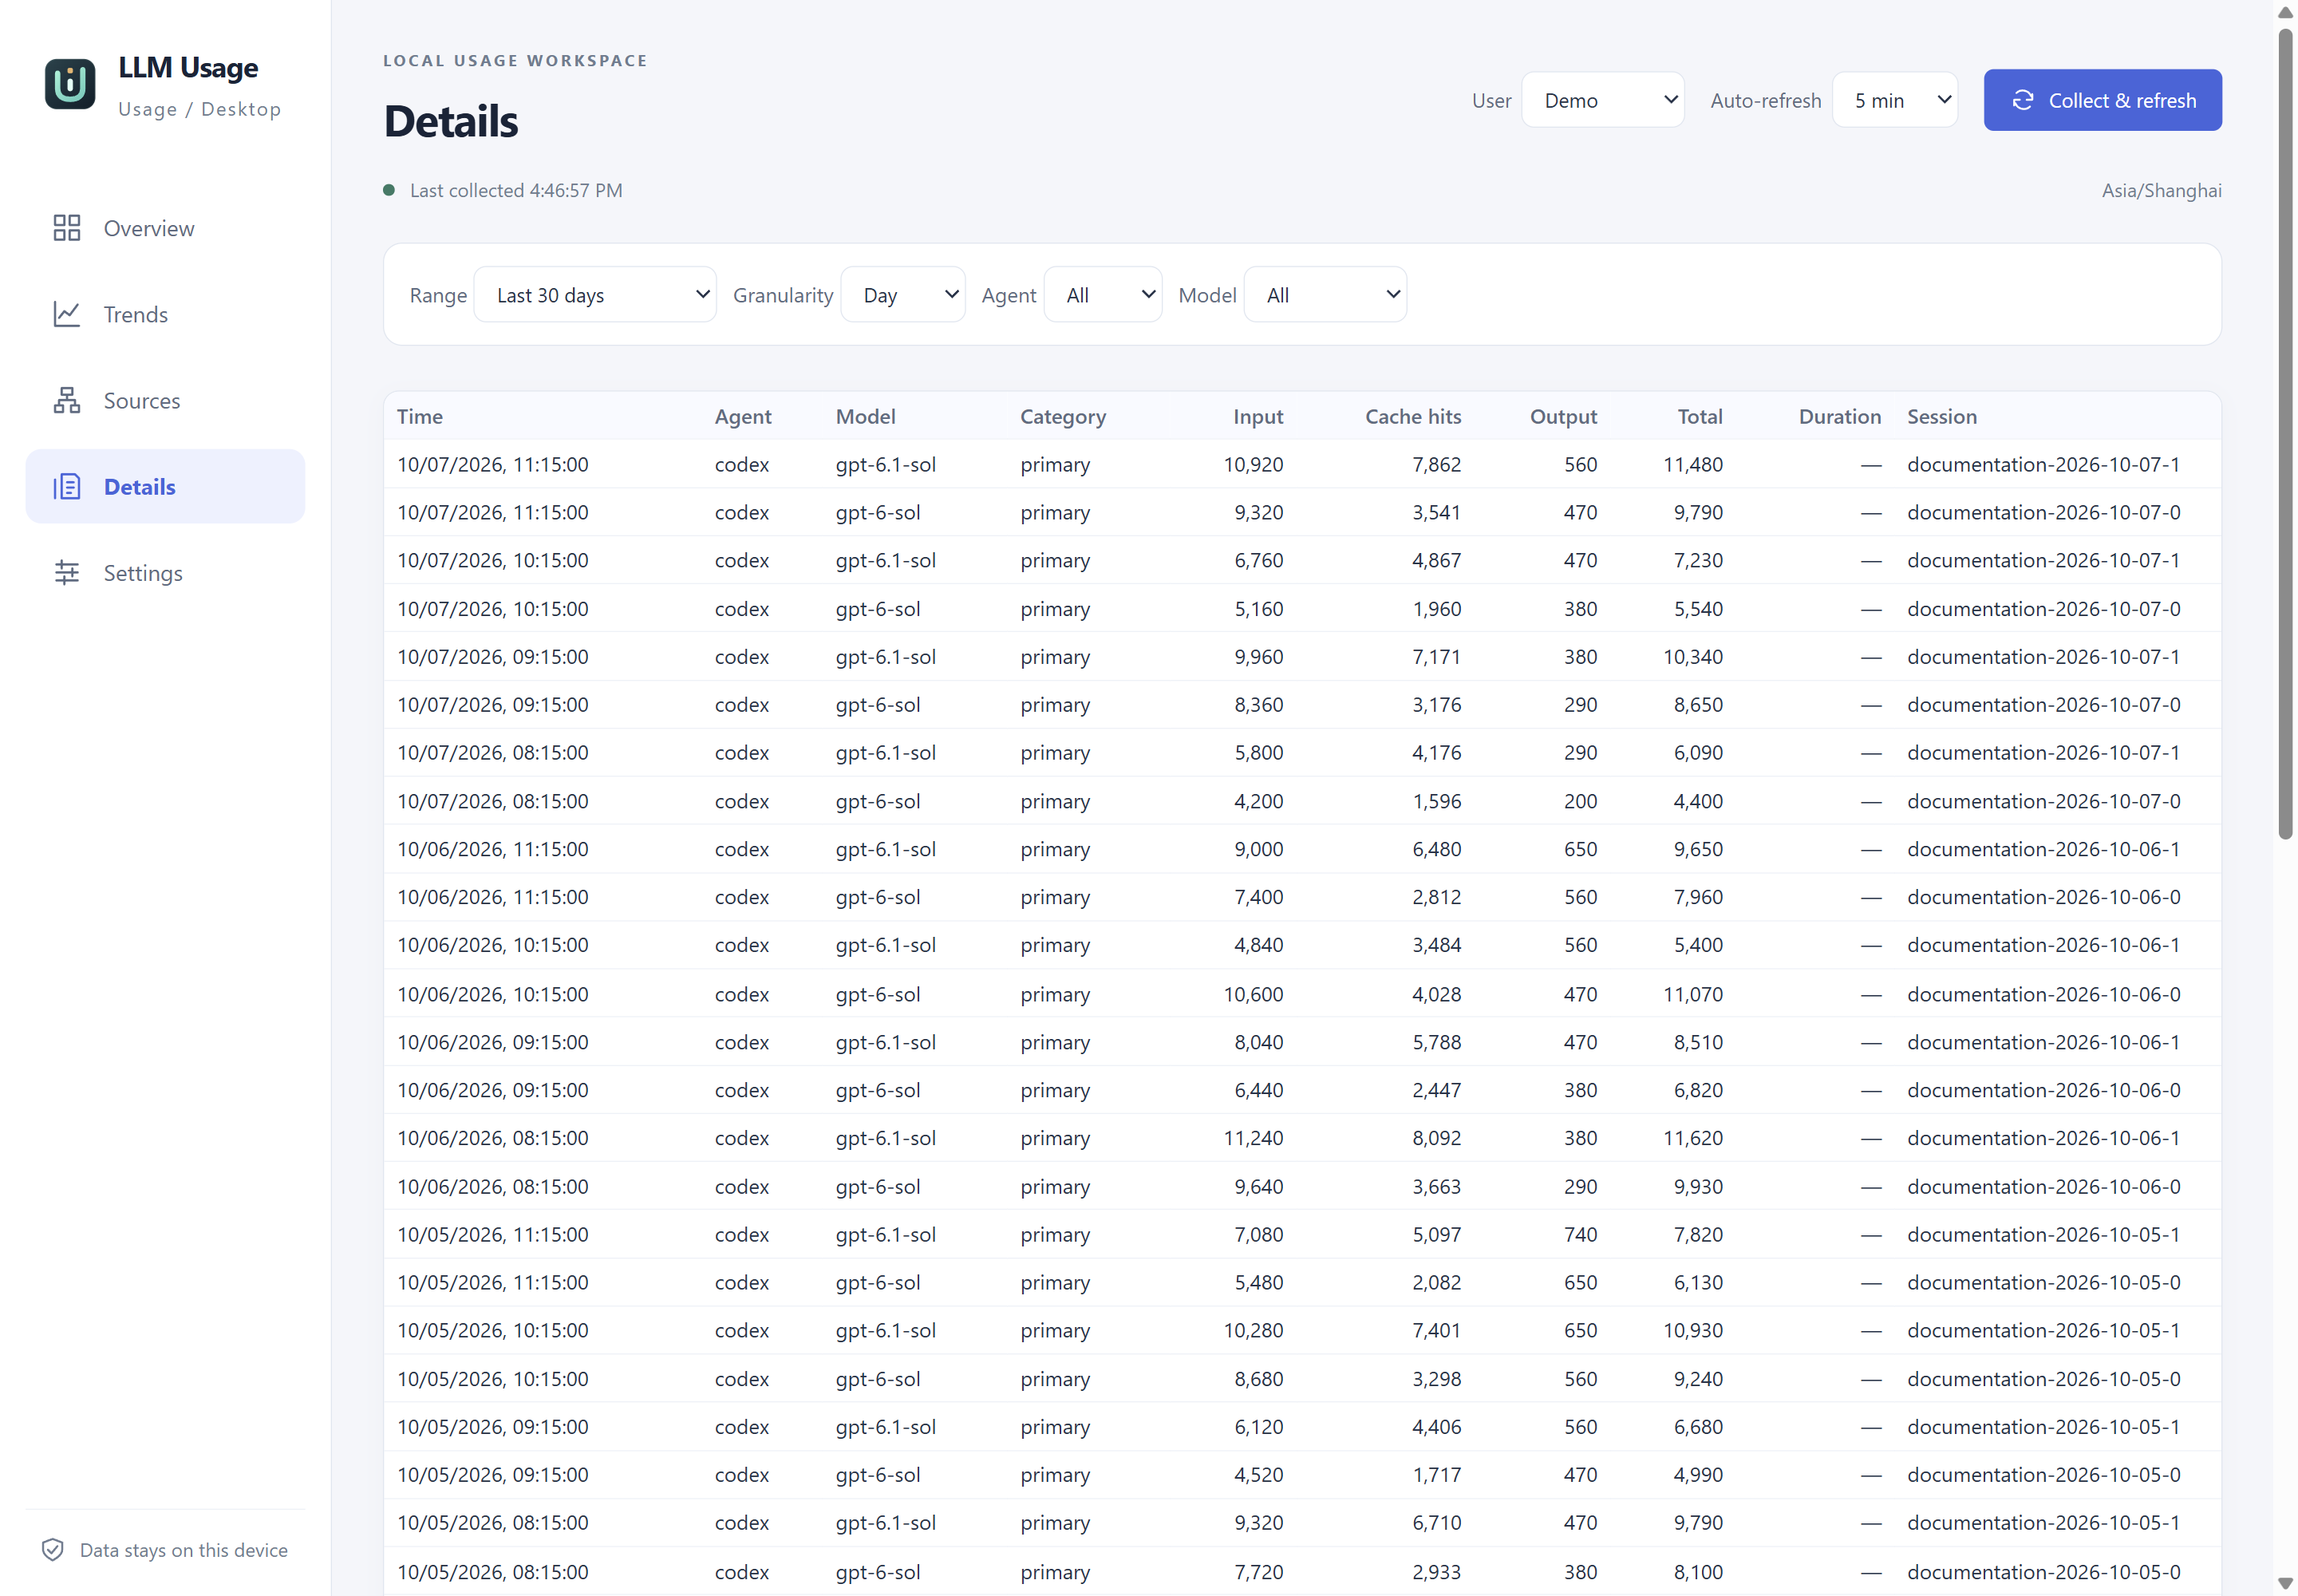
Actual English desktop UI with isolated synthetic Codex records, in light theme. Unknown durations appear as —. Select the image to view the original 2880×2000 PNG.
Layout and accessibility
Overview and Trends panels can be hidden or reordered. Use the layout controls and reset if you want to restore the standard order. Charts offer readable tables, accessible names and keyboard selections. Language changes update labels and formatting; timezone remains a separate statistical setting. See accessibility and the dashboard specification for precise behavior.